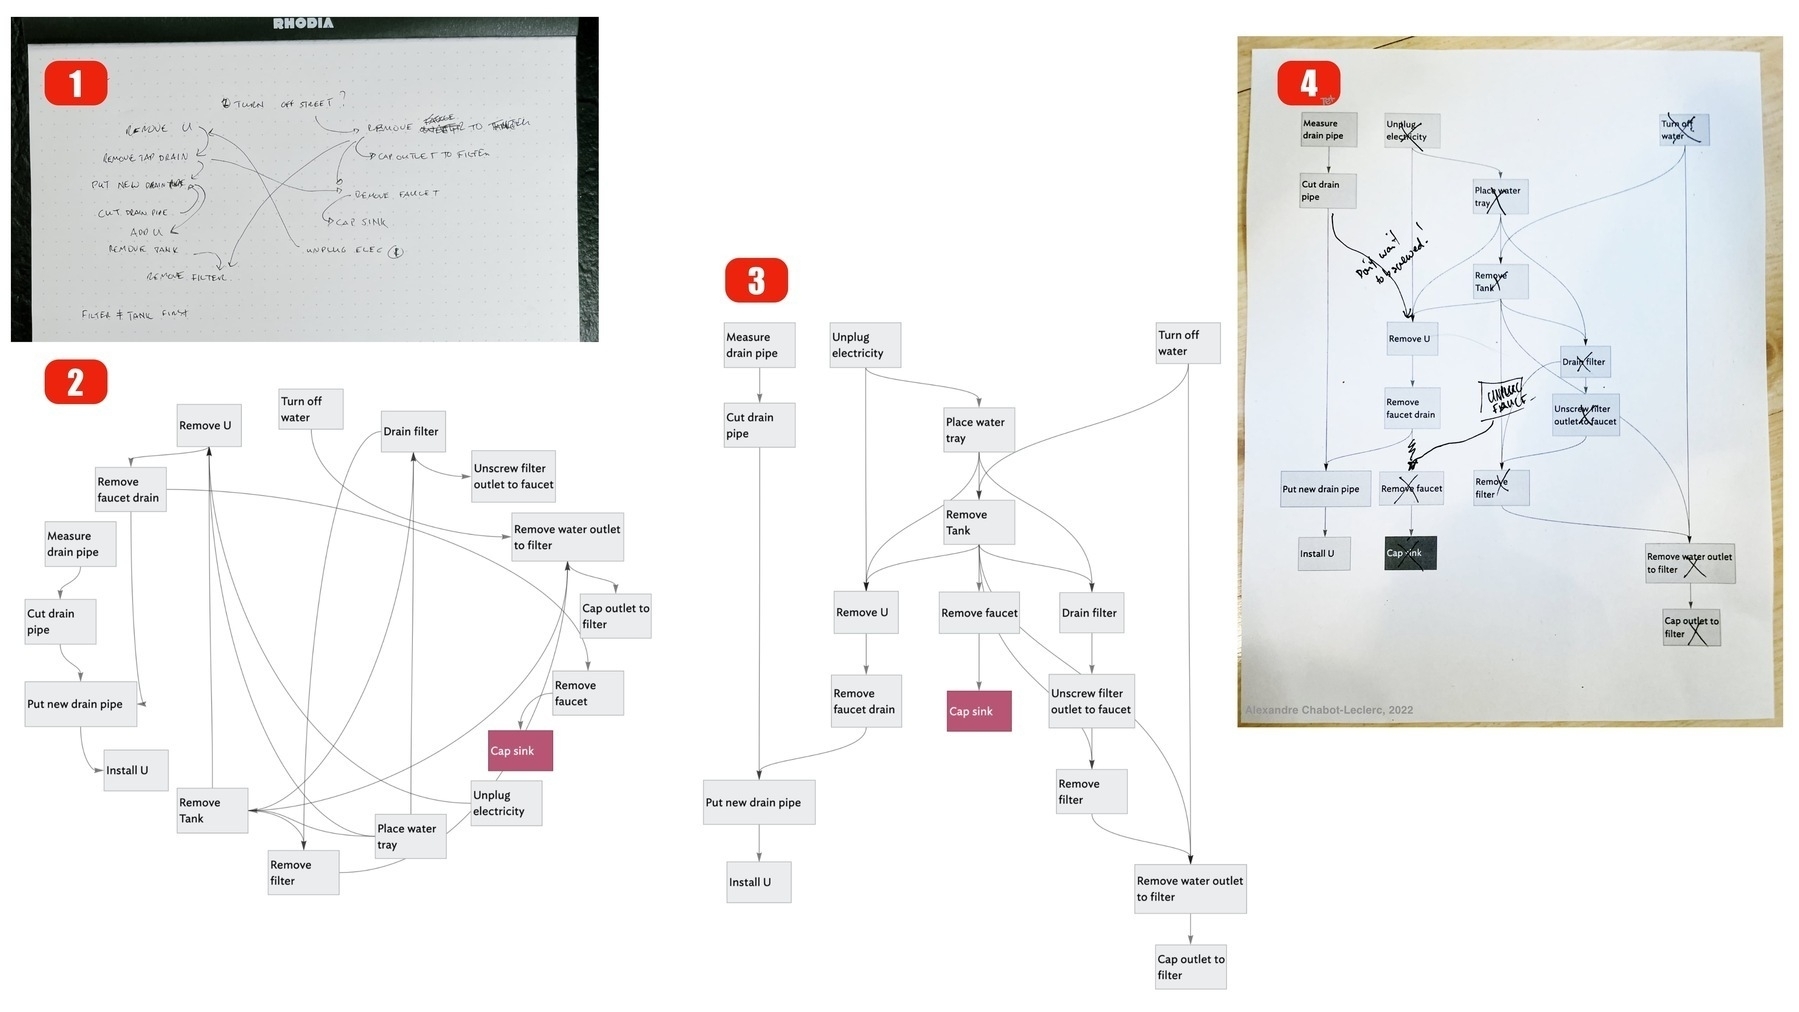
Yesterday, I used Ryan Singer’s interrelationship and causal diagrams to remove a water filtering system from under my sink. The diagrams likely saved me hours of work.
First, while sitting in front of the open cabinet, I wrote on paper all the steps I needed to complete the removal (1). When step “A” needed to happen before step “B,” I drew an arrow from “A” to “B.” Then I redrew the whole thing on the computer (2) so I could move the steps around.
I copied the steps to create the causal diagram (3). Steps without requirements “float” to the top, while steps with requirements are placed 1 level below their “most recent” upstream requirement. Thanks to the causal diagram I realized I missed steps. It was much easier to adjust the diagram than to figure it out in the moment!
Finally, I printed the causal diagram and used it as my checklist while doing the work (4).
I should use these tools more often. They’re powerful.
